
Navigating the political landscape of the USA can feel like trying to find a needle in a haystack—if that haystack was also on fire. With a myriad of states, each boasting its own unique political quirks, understanding the map of USA politics is essential for anyone wanting to stay informed. Whether you’re a seasoned political junkie or just trying to figure out why your neighbor is suddenly obsessed with local elections, this guide will help illuminate the colorful, and sometimes chaotic, world of American politics.
Overview of Political Maps
Political maps of the USA depict the boundaries and divisions of government, highlighting state lines, congressional districts, and local jurisdictions. These maps provide essential insights into voting trends, party affiliations, and political representation across various regions. By studying them, individuals can understand how geography influences political dynamics.
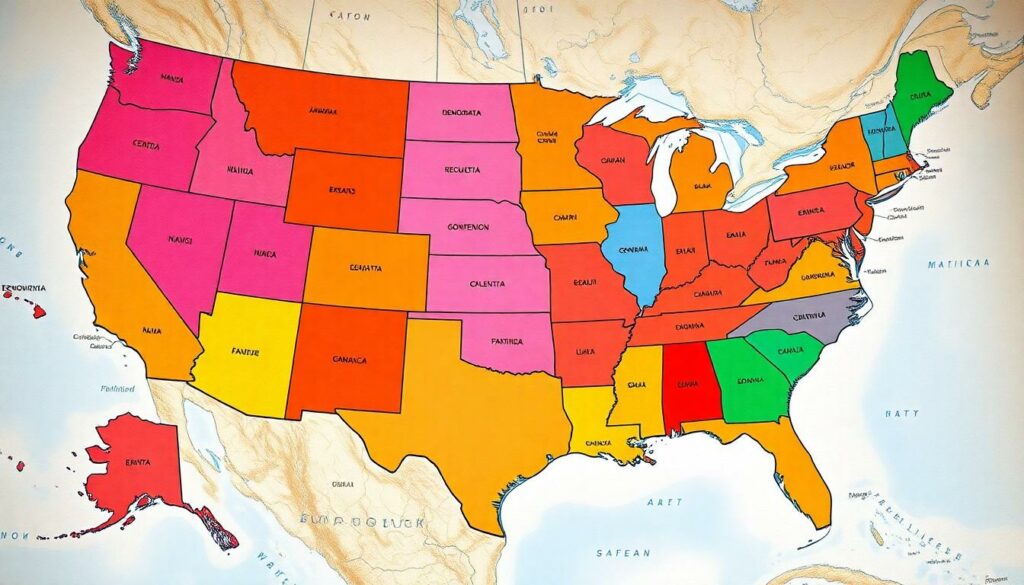
State maps often color-code political affiliation, allowing viewers to quickly identify Republican, Democratic, or swing states. For instance, the 2020 election map showcased stark contrasts, with blue states representing strong Democratic support and red states indicating Republican dominance. Understanding these colors helps grasp the broader political landscape.
Congressional district maps illustrate electoral boundaries for House representatives. Each district contains about 700,000 residents, and shifts in population can lead to redistricting every ten years. This process significantly impacts political power since it can alter representation in Congress.
Voting behavior trends are also visible through these maps. They reveal how demographic factors, such as age, education, and income levels, affect political choices. For example, urban areas tend to vote more Democratic, while rural regions often lean Republican.
Additionally, local political maps highlight municipal and county elections. Such elections play a crucial role in everyday governance, affecting local policies on education, public safety, and infrastructure. Keeping track of these dynamics enables informed participation in local governance.
Emphasizing the importance of political maps fosters a deeper understanding of the political landscape. Analyzing these maps equips individuals with the knowledge necessary to navigate the complexities of the American political system.
Types of Political Maps
Understanding types of political maps enhances knowledge of the political landscape. Each type serves a specific purpose in illustrating political dynamics.
Physical Political Maps
Physical political maps display geographical features alongside political boundaries. These maps present significant elements like rivers, mountains, and lakes with contrasting colors to emphasize state lines. By showcasing natural resources, they help contextualize political decision-making. Voters can identify how geographic elements influence local governance and electoral practices. In addition, these maps allow for a clearer understanding of how terrain can impact campaign strategies and voter turnout.
Thematic Political Maps
Thematic political maps focus on specific political themes, such as voting behavior or party affiliation. Color coding conveys information about electoral trends, showing how regions align politically. Voters benefit from examining these maps during elections, as they reveal shifts in public opinion and demographic influences. Data visualization enhances the ability to analyze complex issues like congressional districts and local elections. Many thematic maps include statistics to illustrate the political climate, providing insights into social and economic factors influencing voter decisions.
Significance of A Political Map of the USA
Political maps of the USA play a crucial role in understanding its complex electoral landscape. They visually depict electoral boundaries, helping citizens comprehend how these areas influence governance and representation.
Understanding Electoral Boundaries
Electoral boundaries define the geographical regions where specific representatives are elected. Local jurisdictions, congressional districts, and state lines all fall within this framework. Each boundary affects the allocation of resources and representation. Changes in population often lead to shifts in these boundaries, impacting electoral outcomes. Understanding these divisions aids voters in discerning who represents them and how their interests align with specific districts.
Analyzing Political Trends
Political maps reveal significant voting trends across different regions. Patterns often emerge based on demographic factors, including age, income, and education. Urban areas typically trend Democratic, while rural regions lean Republican. Color-coded maps illustrate these trends, making it easier to visualize shifts over time. Tracking these changes can offer insights into future electoral outcomes. Thematic analyses of past elections enhance comprehension of evolving political sentiments across the United States.
Key Features of the USA Political Map
Political maps offer a visual representation of the USA’s political landscape and facilitate an understanding of key dynamics in the system.
States and Their Political Affiliations
States display distinct political affiliations that reflect varied ideologies and voter preferences. For example, California leans Democratic, while Texas is predominantly Republican. Swing states such as Florida and Ohio showcase fluctuating party support, influencing national elections. Political maps color-code states, enhancing clarity regarding party dominance. This visual aid helps residents and scholars identify regional voting patterns, which play crucial roles in legislative outcomes. Analyzing historical data reveals how affiliations evolve over time, emphasizing the significance of demographic shifts.
Major Political Regions
Regions such as the Northeast, Midwest, South, and West exhibit unique political characteristics. The Northeast typically supports progressive policies, whereas the South often aligns with conservative values. In the Midwest, political attitudes can vary, creating battlegrounds during elections. Understanding these regions provides insights into broader electoral trends and local governance challenges. Maps often highlight these divisions, showcasing where particular policies resonate most. This context clarifies why certain issues gain traction in specific areas, reflecting the diverse political fabric of the nation.
Conclusion
Navigating the political landscape of the USA requires an understanding of its intricate maps and diverse dynamics. Political maps serve as essential tools in grasping the nuances of electoral behavior and representation across various regions. By analyzing these maps, individuals can uncover trends that reveal how demographic factors influence voting patterns and party affiliations.
Recognizing the significance of swing states and regional characteristics enhances one’s ability to engage with the political discourse. As the political scene continues to evolve, staying informed through these visual aids remains crucial for anyone interested in American politics. Ultimately, a well-informed citizenry is vital for a healthy democracy.


